A Comprehensive Federal Budget Plan to Avert a Debt Crisis

Annual budget deficits are projected to soon surpass $1 trillion, on their way to $2 trillion or even $3 trillion in 10 to 15 years. Social Security and Medicare face a combined $100 trillion cash deficit over the next 30 years, which would push the national debt to nearly 200% of the gross domestic product (GDP). At that point, interest on that debt would consume 40% of all tax revenues—or more, if interest rates rise. Unless reforms are enacted, global markets will, at some point, stop lending to the U.S. at plausible interest rates. When that event occurs, or even approaches, interest rates will soar, and the federal government will not be able to pay its bills, with dire consequences for the U.S. economy.
A debt crisis, in short, looms on the horizon.
There is a way to avert this debt crisis. However, lawmakers must act quickly to reform Social Security and Medicare, as every year 4 million more baby boomers retire into those programs, and the eventual cost of reform rises by trillions of dollars. This report presents a specific 30-year blueprint—each element of which is “scored” using data from the Congressional Budget Office (CBO)—to stabilize the national debt at 95% of GDP.
The fiscal consolidation in this report calls for some Social Security and Medicare benefits for upper-income recipients to be trimmed. Some taxes would rise. Spending on defense would continue to fall as a share of the economy. But antipoverty reforms would be limited to a slight reduction in the growth of Medicaid benefits, and domestic discretionary spending priorities would be largely protected.
Without reform, runaway deficits will all but guarantee a debt crisis that will profoundly damage the country’s economic and social order. There is still time to avoid that crisis, but it will require the nation’s fractious political leaders to leave their respective comfort zones and compromise.
Introduction
Annual budget deficits are projected to soon surpass $1 trillion, on their way to $2 trillion or even $3 trillion in 10 to 15 years. Social Security and Medicare face a combined $100 trillion cash deficit over the next 30 years, which is projected to bring a $100 trillion national debt. At that point, interest on that debt would consume 40% of all tax revenues—or more, if interest rates rise. Unless reforms are enacted, global markets will, at some point, stop lending to the U.S. at plausible interest rates. When that event occurs, or even approaches, interest rates will soar, and the federal government will not be able to pay its bills, with dire consequences for the U.S. economy.
A debt crisis, in short, looms on the horizon, yet most lawmakers tasked with the responsibility of averting it express little interest in doing so. No recent president has presented a specific plan to stabilize the long-term budget. Congress recently enacted tax cuts and discretionary spending increases that—irrespective of any policy merits—will add trillions in debt. Lawmakers promise cheering crowds that they will never trim Social Security or Medicare or accept a penny in new tax increases or defense cuts. Democratic socialists pledge to further increase federal spending by $42 trillion over the decade and $218 trillion over 30 years.[1] Federal spending rises by $150 billion annually[2] while bipartisan resistance greeted a proposal this summer to merely rescind a few billion dollars in spending authority that was not going to be spent anyway.[3]
Petty squabbles over petty spending cuts—and the refusal even to discuss the main drivers of debt—reflect a general unwillingness of Congress, the White House, and, indeed, the citizenry to face the unsustainability of Washington’s current fiscal path.
There is a way to avert this debt crisis without major tax increases or significant cuts to antipoverty and social spending. However, lawmakers must act quickly to reform Social Security and Medicare, as every year 4 million more baby boomers retire into those programs, and the eventual cost of reform rises by trillions of dollars.
This report presents a specific 30-year blueprint—each element of which is “scored” using the most recent Congressional Budget Office (CBO) Long-Term Budget Outlook—to stabilize the national debt at 95% of the gross domestic product (GDP). Section I identifies the drivers of the long-term debt. Section II addresses false “easy” solutions deployed to avoid real reform. Section III presents the blueprint. Section IV defends the blueprint against both conservative and liberal objections.
The fiscal consolidation in this report calls for some Social Security and Medicare benefits for upper-income recipients to be trimmed. Some taxes would rise. Spending on defense would continue to fall as a share of the economy. In short, there is something in this blueprint for everyone to oppose. But letting the country wander into a debt crisis is even worse.
To be sure, deficit-reduction proposals are common. The problem is that most congressional budget proposals simply assume generic (and unrealistic) long-term spending and tax targets without spelling out the specific programmatic reforms that could meet those targets. Across the policy community, long-term budget proposals often reflect liberal or conservative dream scenarios rather than plans that can appeal to both parties.
By contrast, the blueprint presented here is specific, scored, and represents politically realistic solutions rather than partisan fantasies. It is intended to revive serious bipartisan discussion and negotiations.
I. Why the Debt Is Soaring
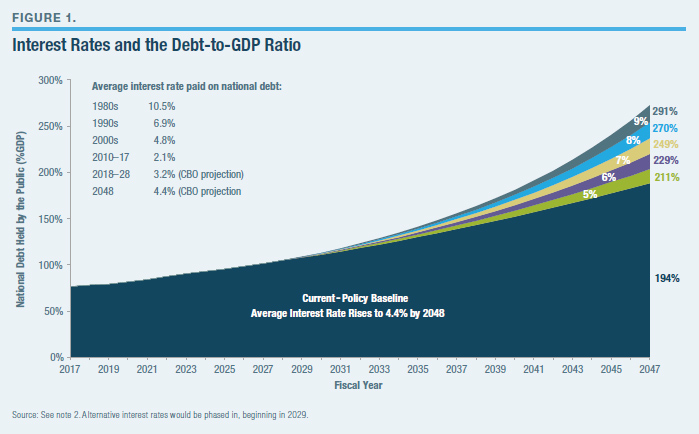
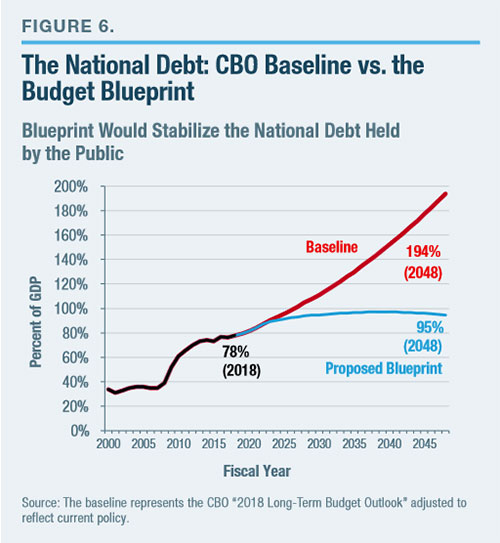
From the mid-1950s through 2008, the national debt held by the public averaged 35% of GDP.[4] This level of borrowing could easily be absorbed by the increasingly global financial markets, and it resulted in interest costs averaging 2% of GDP (roughly 10% of a typical federal budget). Since 2008, the great recession and the beginning of the baby-boomer retirements have more than doubled the debt, to 78% of GDP. If current policies continue, the debt is projected to reach an unprecedented 194% of GDP within 30 years.[5] And if this debt brings higher interest rates (as consensus economic theory suggests),[6] the debt could surpass 250% of GDP (Figure 1),[7] and servicing the debt could cost 7.5% of GDP—the equivalent of $1.5 trillion in today’s economy. Americans of all incomes would face unprecedented tax increases; higher interest rates for home mortgages and car, student, and business loans; and a significant economic slowdown. Unlike Greece’s, the U.S. debt would be too large to be easily absorbed by the global economy.
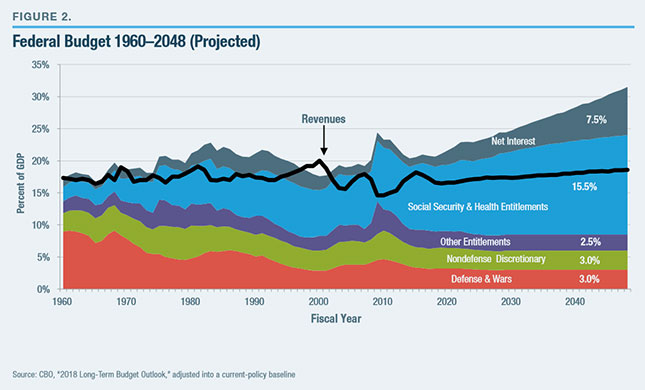
What is causing the debt rise? Not inadequate tax revenues—which, since the early 1950s, have usually remained between 16.5% and 18.5% of GDP, regardless of tax policies, and which are projected to rise above historical norms, to 18.6%–19.8% of GDP, depending on the fate of various expiring tax cuts and delayed tax increases.[8] Nor is it driven, on the spending side, by aggregate expenditures for discretionary and smaller entitlement programs, which are projected to continue falling as a share of the economy.
Figure 2 shows that the entire increase in long-term debt will come from surging Social Security, Medicare, and other government health-care spending. According to the CBO, these costs have risen from 7% to 10% of GDP since 2000 and are projected to reach 15.5% of GDP by 2048—or 21.8% of GDP when the interest cost of Social Security and Medicare’s annual deficits are included.
Why Social Security and Medicare Are Going Bankrupt
Between 2008 and 2030, 74 million Americans born between 1946 and 1964—on average, 10,000 per day— will retire and receive Social Security and Medicare benefits. Of this group, those retiring at age 66 and living to age 90 will spend one-third of their adult life receiving federal retirement benefits. The combination of more retiring baby boomers and longer life spans will expand Social Security and Medicare caseloads far beyond what current taxpayers can afford under current benefit formulas. In 1960, five workers paid the taxes to support each retiree (and, of course, Medicare did not exist). The ratio of workers to retirees has now fallen below 3–1, on its way to 2–1 by the 2030s. When today’s kindergartners are adults, each married couple will basically be responsible for the Social Security and health care of their very own retiree.
These demographic challenges are worsened by rising health-care costs and repeated benefit expansions enacted by lawmakers. Today’s typical retiring couple has paid $140,000 into Medicare and will receive $420,000 in benefits (in net present value), in part because Medicare’s physician and drug benefits are not pre-funded with payroll taxes, and only partially funded by retiree premiums. Most Social Security recipients also come out ahead.[9] Thus, most seniors’ benefits greatly exceed their lifetime contributions to the Social Security and Medicare systems. By 2030, the 74 million baby boomers will have joined a retirement benefit system that runs a substantial per-person deficit.
According to CBO, between 2018 and 2048, Medicare is projected to run a $41 trillion cash deficit, Social Security will run an $18 trillion cash deficit, and the interest on the resulting program debt will be $41 trillion (Figure 3).[10] (To adjust these 30-year totals for inflation, trim by one-third.) Rather than adequately self-finance through payroll taxes and premiums, these two programs are set to add $100 trillion to the national debt. The rest of the federal budget is projected to run a surplus over the next 30 years.
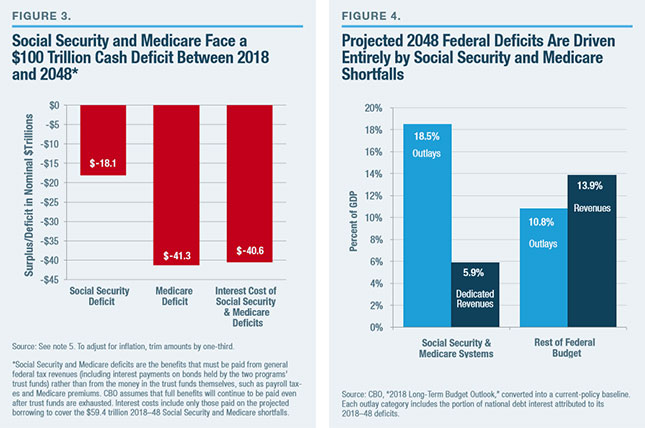
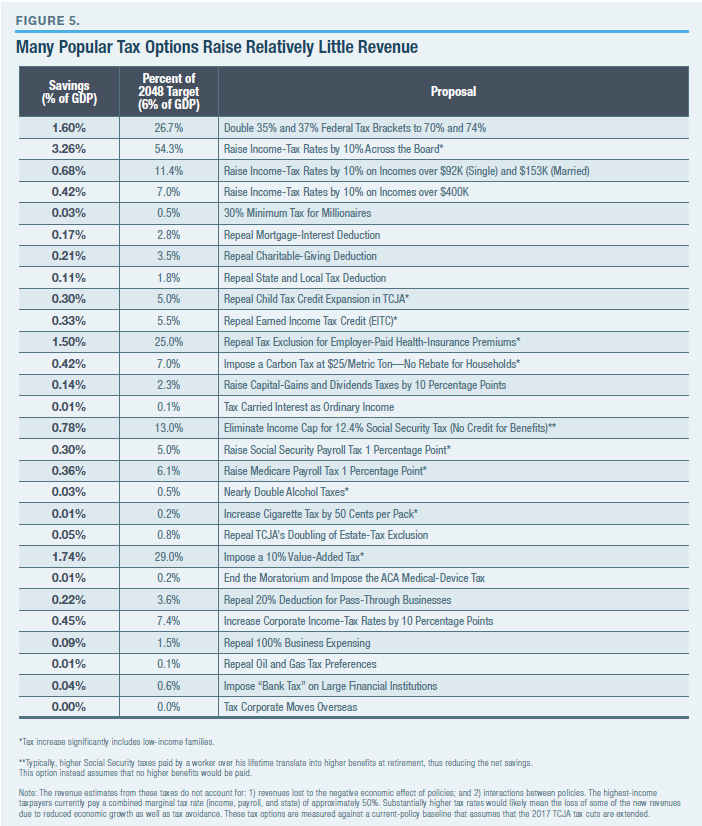
Figure 4 expresses the same projections in a different manner. By 2048, Social Security and Medicare will collect 5.9% of GDP in dedicated revenues and spend 12.2% of GDP in benefits—plus 6.3% of GDP in interest costs resulting from these two programs’ deficits. That 12.6% of GDP budget deficit resulting solely from Social Security and Medicare is unsustainable.
The Fiscal Winter Is Coming—and Autumn Has Already Arrived
Since 2008—when the first baby boomers qualified for early retirement—Social Security and Medicare have accounted for 60% of all inflation-adjusted federal spending growth (with Medicaid and the Affordable Care Act responsible for an additional 31%). The majority of budgetary savings achieved by discretionary spending caps, defense cuts, and rising tax revenues have simply financed growing Social Security and Medicare costs, which will grow by another $130 billion annually over the next decade.[11] That is the equivalent of creating another Defense Department every five years. This will happen automatically, without any congressional votes and therefore likely with scant media coverage.
And as federal resources further shift to the elderly, Washington is beginning to run out of offsetting spending cuts. This has contributed to the deficit expanding from $438 billion to $666 billion over the past two years. CBO’s current-policy baseline shows deficits rising to $2 trillion within a decade—or $3 trillion, if interest rates return to historical norms. Unlike the temporary, recession-driven budget deficits a decade ago, these Social Security- and Medicare-based deficits will expand permanently. Over the next 30 years, CBO projects that the national debt will grow from $20 trillion to $99 trillion ($54 trillion after inflation)—or much higher, if interest rates rise from the projected 3%–4% range to the historically typical 5%–6%.
President Trump’s latest budget proposal shows the impossibility of reining in deficits without Social Security and Medicare reform. By allowing these programs to nearly double over the decade, from $1.6 trillion to $3.0 trillion, the White House is forced to propose slashing other entitlement spending as a share of GDP by onefifth over the decade and cutting both defense and domestic discretionary spending to levels—as a percentage of GDP—unseen since the 1930s. Yet even if these implausible cuts were enacted, CBO still estimates a budget deficit topping $1 trillion by 2028.[12] This deficit would continue escalating thereafter because Social Security and Medicare costs would continue growing even after Washington would have run out of other spending to cut.
Predictably, most of the popular blame for the rising deficits is currently pinned on the 2017 Tax Cuts and Jobs Act (TCJA). TCJA will likely decrease revenues by roughly 1% of GDP indefinitely if extended past 2025, when parts of the law are currently scheduled to expire.[13] (This does not include additional tax revenues that will arise from economic growth that lower tax rates will induce. The congressional Joint Committee on Taxation estimates that these additional tax revenues would offset the additional interest costs of the tax law, though not the primary deficit-increasing impact of the tax cuts themselves.) While the government revenues forgone by TCJA will surely worsen deficits, they are a much smaller contributor than Social Security, Medicare, and Medicaid, spending on which will together rise by 2.6% of GDP over the decade and 5.4% over 30 years.[14] Even without the 2017 tax cuts, the annual deficit would still exceed $1.7 trillion within a decade. In short, TCJA did not create the federal government’s large deficits, and even repealing them would not absolve lawmakers of the need to address rising entitlement spending.
How a Crisis May Play Out
The national debt’s share of the economy cannot rise forever. At a certain point, even large global savings markets will be stretched, and investor confidence in America’s ability to finance its debt will evaporate. The timing of a country’s debt crisis depends as much on market psychology as on economic fundamentals. But eventually, as the debt steeply escalates, investors will move from unease to panic and demand higher interest rates to finance the federal government. These higher rates will make it extremely difficult for businesses to borrow and invest, and will make auto loans, student loans, and home mortgages less affordable, while also forcing unprecedented tax increases and/or spending cuts to pay for Washington’s higher interest costs. Such an outcome is highly likely if annual deficits continue growing past 10% of GDP and the debt continues to approach 200% of GDP, as projected in the current- policy baseline. On the one hand, America will have some leeway due to its reputation as a safe harbor for investment and status as the world’s reserve currency. On the other hand, absorbing a debt of nearly 200% of America’s economy would be much more expensive for the global markets than absorbing, say, 200% of a smaller GDP, like that of Greece.
In the absence of fundamental reform, the more likely scenario is a series of minor investor panics (forcing up interest rates), followed by upper-income tax increases and lower-priority spending reductions that are insufficient to finance the rising entitlement and interest costs. Eventually, Washington will run out of such offsets to reduce deficits, leaving only the choice between historically large middle-class tax increases and a drastic reduction in Social Security and Medicare benefits for current retirees.
II. The Mirage of “Easy” Solutions
Standing in the way of making the changes to be outlined in this budget plan—or other plausible proposals to avert a debt crisis—are a series of false claims that the problem is easily solved.
Economic Panaceas
Steep economic growth. A strong economy is necessary but far from sufficient for major deficit reduction. Growth rates will already be limited by the labor-force slowdown caused by baby-boomer retirements and declining birthrates. That leaves productivity to drive growth.
So, no problem? Let’s start by disregarding CBO’s 2018 projection that total U.S. factor productivity will continue growing at the 1.2% average rate of the past 30 years and instead assume the white-hot 1.8% rate that prevailed from 1992 through 2005.[15] Most economists[16] would consider this rate far too optimistic.[17] Nevertheless, the resulting higher incomes and tax revenues from this productivity jet stream would seem to close at least 40% of the cumulative deficits through 2048—until one accounts for the fact that higher incomes automatically result in higher Social Security benefits when the workers who earned them retire.
Much can be done to increase real economic growth rates above CBO’s long-term 1.9% annual projections. In particular, lawmakers should aim to grow the labor-force participation rate; continue to refine the tax code to encourage work, savings, and investment; and improve policies in the areas of trade, energy, job training, education, and health care. However, a refusal to address surging spending and deficits would still undermine economic growth by raising interest rates, decreasing business investment, and ultimately forcing up taxes. Lawmakers should aspire to faster growth but not simply assume it—especially if entitlement costs keep growing.
Inflate the debt away. In the short term, higher inflation can dilute some of today’s $20 trillion national debt. However, Social Security and Medicare benefits and payments are also tied to inflation, so future liabilities would expand. Additionally, Washington would have to pay much higher interest rates when borrowing to finance those benefits.
Low interest rates. CBO’s 2018 Long-Term Budget Outlook assumes that the national debt can rise from 35% to 150% of GDP between 2007 and 2048, with its average interest rate peaking at just 4.4%—which is below even the levels of the 1990s (6.9%) and 2000s (4.8%). By contrast, the economic-policy community consensus is that such a large increase in federal debt would raise interest rates.[18] For each percentage point that interest rates rise, Washington must pay approximately $13 trillion more in interest costs over 30 years.[19] That means an even higher national debt.
Immigration. Smart immigration policy may, on net, marginally improve the federal budget picture (and the economy). It is not a cure-all. High-skill immigrants send higher tax revenues during their working careers, but their eventual retirement into Social Security and Medicare would add new liabilities to the system. Lowskill immigrants generally increase costs to the federal government (and especially to state and local governments)—at least, in the first or second generation, because the resulting education, infrastructure, and social spending exceeds the added tax revenues.[20]
Conservative Fantasies
Pro-growth tax policy. Economic growth is obviously important to deficit reduction—and tax legislation that depresses savings and investment must be avoided. Nevertheless, the historical record clearly shows that the vast majority of tax cuts do not increase tax revenues— especially by enough to keep pace with federal programs growing 6%–7% annually.[21]
Eliminating welfare and lower-priority spending. Over the past 15 years, congressional GOP deficit-reduction budget plans have typically imposed nearly all the first decade’s cuts on antipoverty programs (Medicaid, ACA subsidies, SNAP [aka food stamps], and others) as well as nondefense discretionary spending, such as education, veterans’ health, homeland security, medical research, and infrastructure. This pot of spending—7% of GDP and declining—would have to be mostly eliminated to balance the budget a decade from now.[22] These cuts will never be passed by any Congress, as their advocates on Capitol Hill and in top think tanks surely know. While there are any number of failed and unnecessary programs in need of major reform, proposals to eviscerate these entire categories of spending while letting Social Security and Medicare off the hook are a politically delusional distraction.
Impossibly tight spending caps. Spending caps are a vital tool to enforce realistic spending targets. But absent any achievable underlying programmatic reforms to meet those targets, they are an empty gimmick. Nevertheless, many conservative budget blueprints simply divide the federal budget into five to eight spending categories and then assume unprecedented cuts in targeted categories, with no underlying policy proposals to achieve those targets. For instance, President Trump’s latest budget proposal assumes a 60% reduction by 2028 in total nondefense discretionary spending as a percentage of GDP. The budget proposal provides no breakdown of which specific programs would be slashed, and how they would operate once all cuts are enacted.[23] The 2011 Budget Control Act has shown that overly tight caps will be canceled rather than force politically suicidal cuts.
Devolution to state governments. There is a strong policy case for allowing states to have more control over poverty relief, education, infrastructure, economic development, and law-enforcement spending. However, counting the federal savings from devolution as the centerpiece of a deficit-reduction strategy is disingenuous because it simply shifts the deficits and taxes to the state level (minus modest efficiency gains that might come from better state fiscal management). The purpose of deficit reduction is to limit government borrowing and tax increases (and to limit economic damage), not merely to change the address where the taxes are sent.
Liberal Fantasies
“Just tax the rich.” Liberal advocates often vastly overstate the degree to which upper-income tax increases can finance the ever-expanding government. In the first place, the U.S. already has the most progressive tax code in the OECD—even adjusting for differences in income inequality.[24] And setting aside the moral questions that would be raised by the government seizing the vast majority of any family’s income, basic math shows that large tax increases on high-income Americans cannot close most of the long-term budget deficit.
Start with an extreme proposition: a 100% tax rate on all income over $500,000. Result: this would raise barely more than 5% of GDP—at least for year one.[25] After that, one needs a heroic, if not absurd, projection that this tax would have no effect on working or investment. Next, try a slightly more realistic doubling of the top 35% and 37% tax brackets, to 70% and 74%. Result: this would raise only approximately 1.6% of GDP (Figure 5)—and even that figure ignores all revenues lost to the economic effects of 85% marginal tax rates (when including state and payroll taxes) on work or investment, as well as tax avoidance and evasion.
Popular proposals to impose a 30% minimum tax on “millionaires” and to more aggressively tax banks, hedgefund managers, and oil and gas companies would raise a combined 0.1% of GDP—or lose revenue if they trim the economic growth rate by even 1/20 of 1% (0.0005).[26] The 0.4% of GDP raised by a $25 per metric ton carbon tax would be passed on to households through higher energy bills.
The top-earning 5% of families and pass-through businesses currently account for 30% of all income.[27] That means that 70% of this tax base comes from those outside the top 5%. Furthermore, that top 5% already pays 42% of all federal taxes, including 61% of all federal income taxes, which leaves less room for additional taxes.[28] So while some upper-income tax increases are possible, the idea that America can close an $18 trillion Social Security shortfall and $41 trillion Medicare shortfall—and even pay for additional spending proposals on the liberal agenda—solely by sticking it to the rich is a fantasy that finds no support in budget math.
Nor can corporate tax hikes close much of the gap. America’s total corporate tax revenues are generally in line with other developed nations. Although modest reforms may be on the table, major changes, such as a 10-point rate increase, would raise less than 0.5% of GDP while giving more companies an incentive to relocate abroad. Repealing the 2017 TCJA would not significantly raise corporate tax revenues, either, as that portion of the law was almost entirely “paid for” through a combination of tax offsets and additional revenues from projected economic growth.[29]
An inescapable reality gets lost in this country’s intractable budget debates: If America wants to spend like Europe, it must also tax like Europe. This means, in addition to federal and state income taxes, a value-added tax (VAT)—essentially a national sales tax—that affects all families. Lawmakers who pledge to stabilize the debt without touching government spending would need new tax revenues equivalent to a VAT that rises to 17% by 2030 and 34% by 2048. Alternatively, lawmakers could raise the payroll tax from 15.3% to 33.5%.[30]
Rather than concentrating all the revenues within one tax, Figure 5 shows that a combination of large income, payroll, capital-gains, corporate, and value- added tax increases would likely be needed to raise 6% of GDP and stabilize the debt without touching Social Security, Medicare, Medicaid, and antipoverty and social spending. While it is easy to say major spending decreases are a nonstarter, the all-tax alternative is even less plausible.
Deep defense cuts. Since the 1980s, the Pentagon budget has fallen from 6% to 3% of GDP—not far above Europe’s target of 2%. Cutting U.S. defense spending to the levels pledged by European members of NATO would save 1% of GDP, or roughly one-seventh of the Social Security and Medicare long-term shortfall. And Europe’s target level is possible only because its leaders can count on protection from a larger superpower—a luxury that the U.S. would not enjoy. A healthy portion of America’s higher defense budget comes from spending $100,000 per troop in compensation (salary, pension, housing, health care, and other benefits), which lawmakers are not eager to cut.[31] Some long-term budget savings are possible, though it should be noted that President Obama did not propose reducing the Pentagon budget to anywhere near the levels of France or the U.K.
Single-payer health care. When confronted with rising Medicare and Medicaid costs driving federal deficits, a popular response on the left is to propose single-payer health care. The theory here is that a fully socialized health plan would drastically slash costs to families and the federal budget.
There is some debate over whether single-payer would slightly increase or decrease total national health expenditures. The most generous analysis of Senator Bernie Sanders’s “Medicare-for-All Act,” performed by the Mercatus Center, shows a 3% reduction in projected national health expenditures.[32] Although those savings charitably rely on the bill’s assumption that private health insurance can be nationalized with reimbursement rates for its health providers cut by approximately 40%—a massive reduction that the Mercatus Center analysis notes is wildly implausible. Analyses that assume more realistic payment rates, such as those performed by the politically liberal Urban Institute, show a notable increase in national health spending under single-payer health care.[33]
Regardless of whether total nationwide health spending would slightly rise or fall, it is obvious that transferring the entire health-care system to the federal government would substantially increase federal spending. Thus, virtually all analyses of single-payer health care—from the politically liberal Urban Institute to the conservative Mercatus Center—have estimated a first-decade cost of $24 trillion–$29 trillion to the federal government.[34] That is on top of current federal health spending that is already growing at unsustainable rates. And if the large provider payment rate reductions prove to be unrealistic, the cost will rise by trillions more.
Some suggest that these new federal costs would be fully “paid for” by the health savings to families, businesses, and state governments.[35] This response leaves unanswered the rather large question of how to convert every dollar of current private-sector and state- government health spending into a nearly $30 trillion “single-payer tax.” Single-payer advocates have still not provided a tax proposal that covers more than half of the exorbitant federal cost. The most likely option, a payroll tax, would need to be set at 30%, on top of the current 15.3% rate.[36] There is no indication that Americans would accept tax increases this large, even if they no longer pay premiums for health insurance.
Furthermore, these new taxes would finance only the added federal costs of the new single-payer system— not the underlying cost of current federal health spending. In other words, “Medicare for All” would not address Medicare’s projected $41 trillion cash shortfall over the next three decades. It would simply make Medicare more generous, and then expand it to everyone under age 65. Perhaps lawmakers should figure out how to pay for the current Medicare system before pledging nearly $30 trillion per decade to expand it.[37]
Cross-Partisan Fantasies
Social Security trust fund to the rescue. Some suggest that redeeming the $3 trillion in assets held by the Social Security trust fund will shield taxpayers from the cost of Social Security’s deficits. In the first place, this $3 trillion accounts for a small fraction of the system’s $18 trillion cash deficit over 30 years. More important, the trust fund contains no economic resources with which to pay benefits—it consists of a pile of IOUs in a filing cabinet in Parkersburg, West Virginia. This $3 trillion in Social Security assets reflects a $3 trillion liability for taxpayers, who must repay the bonds with interest over the next 16 years. All future Social Security benefits will be financed by future taxes and borrowing.
Long-term budget projections are just theory. Americans otherwise inclined to be skeptical of 30-year projections should nevertheless take these seriously. Future inflation rates are indeed anyone’s guess, but the 74 million baby boomers retiring into Social Security and Medicare are an actuarial and demographic reality. These present and future retirees exist, and the payment formulas have already been set. Furthermore, any future uncertainties are an argument for caution and prudence.
There is no hurry. Some assert that lawmakers can wait 10 or 15 years to address this challenge.[38] Unfortunately, every year of delay raises the eventual cost of a budget fix because: 1) on average, 4 million more baby boomers retire into Social Security and Medicare, and lawmakers have generally avoided reducing benefits for those already receiving them; 2) benefit levels rise further above an affordable level; and 3) the larger national debt locks in permanently higher interest costs. The blueprint in this report assumes that most reforms are implemented in 2023—which means that stabilizing the debt at 95% of GDP requires the sum of annual tax increases and (noninterest) spending cuts to rise to 6% of GDP by 2048. Those required 2048 savings rise to 9% of GDP if reforms are delayed until 2030, and 12% of GDP if reforms do not begin until 2035.[39]
Let the kids deal with the problem. The final argument against reform asserts that Social Security and Medicare benefits represent an unbreakable, unamendable promise to the elderly, consequences be damned. In reality, retirement benefits have been repeatedly expanded far beyond what current retirees were promised while they were working. For example, President George W. Bush and Congress decided in 2003 that current taxpayers would pay 75% of the prescription-drug costs of the current typical senior. This benefit was never “earned” through payroll taxes. And today’s teenagers never signed up for this budget-busting deal.
III. A Bipartisan Plan to Stabilize the Long-Term Federal Budget
A realistic path to averting the country’s future debt crisis will require lawmakers to reject gimmicks, slogans, and empty budget targets in favor of plausible changes to the current arc of federal spending and taxes—specific changes whose effects on the federal budget can be scored by CBO methodology. And because deficit-reduction policies are never popular, major reforms need to be enacted on a bipartisan basis, much like the 1983 Social Security reforms. Any attempt to pass these major changes on a party-line vote would undermine their public legitimacy, would be politically suicidal, and would likely be repealed when the opposition party returns to power.
The path put forward in this report is meant to achieve these objectives:
- Long-term fiscal sustainability. Moving to a fully balanced budget is probably not possible. However, stabilizing the national debt around 95% of GDP— near the level projected in 2023, when most policies would be implemented—would likely stabilize the cost of interest on the national debt and the debt’s effect on the economy. This means annual budget deficits gradually declining to 3.2% of GDP over three decades.[40] Sustainability also means that both spending and tax revenues stabilize as a percentage of GDP rather than continue to rise in tandem. Finally, longterm sustainability means that showy reforms, such as across-the-board discretionary spending cuts, are less important than subtle entitlement reforms that produce larger savings over time.
- Achieve most savings from major mandatory programs. There are three reasons for this objective. First, it’s the only solution that addresses the underlying problem. Mandatory spending is the primary factor driving the debt upward. CBO’s long-term baseline shows that 100% of the long-term increase in annual budget deficits as a share of the economy comes from the rising cost of Social Security, Medicare, and other health entitlements, as well as the resulting interest on the debt. Remaining federal spending is projected by CBO to continue falling as a share of the economy. Tax revenues are projected to rise above average levels. It is not sustainable to chase ever-rising entitlement costs with ever-rising tax rates, or to eviscerate all other federal programs.
The second reason is generational equity. Drowning younger workers in ever-rising taxes is no more moral than drowning them in debt, particularly when the entire additional tax burden will finance the largest intergenerational wealth transfer in world history. Retirees are typically wealthier than working-age men and women;[41] and over the years, Social Security and Medicare benefits have been enacted that far exceed retirees’ lifetime contributions to the programs. Rather than passing this burden on to their kids, they have a responsibility to pare back their benefits to affordable levels.[42]
The third reason is economic. The level of tax increases that would be necessary to keep pace with escalating entitlement spending—including a 33% payroll-tax rate or a 34% VAT—would retard economic growth. Across other countries, the most successful fiscal consolidations—such as Finland and the U.K. in the late 1990s—have averaged 85% spending restraint and 15% new taxes.[43] Consolidations that failed or significantly harmed the economy were typically split more equally between new taxes and spending restraint. - Specific and plausible changes only. Most other long-term budget proposals show larger and more immediate budget savings than this blueprint. Unfortunately, those savings usually rely on some combination of:
- Overly optimistic economic growth assumptions;
- The immediate implementation of extraordinarily complicated and controversial reforms to major programs that in reality would take several years to draft, pass, implement, and phase in;
- Aggressive spending cut or tax increase targets along with sample policy proposals that add up to only a small fraction of the required budgetary savings;
- Heavy reliance on unrealistically tight spending caps without showing how to meet them; and
- Combining various tax increase proposals that collectively result in unrealistically high tax burdens for certain groups, or that generally duplicate or contradict one another.
Additionally, many long-term budget proposals are based on liberal or conservative pieties such as taxing the rich at ultrahigh rates or eliminating most welfare and domestic discretionary spending. This blueprint attempts to thread the needle of effective policy and the political reality that any major, lasting deal must be bipartisan.
This budget blueprint works within the current structure of government, rather than proposing complete rewrites of major programs or the tax code. It divides reforms into four tiers and seeks maximum savings in a given tier before moving to the next:
- Tier 1: Squeeze out inefficiencies from the major health programs driving spending upward.
- Tier 2: Trim Social Security and Medicare benefits for upper-income retirees.
- Tier 3: Trim other federal programs to the extent feasible on a bipartisan basis.
- Tier 4: Close the remaining gap with new taxes in the broadest and least-damaging manner possible.
The blueprint also provides that: the lowest-income 40% of seniors are protected from any Social Security or Medicare cuts (although the Social Security full-benefit retirement age would largely rise); spending cuts to antipoverty programs are largely avoided; parity between discretionary defense and nondefense spending is maintained; Washington’s structural budget deficits are not passed on to the nation’s governors; tax increases are kept within reasonable limits; policy changes are phased in gradually, mostly beginning in 2023; and economic growth is assumed to be no faster than in CBO’s longterm projection.
The first step toward scoring a long-term budget is a credible 30-year baseline. Regarding this blueprint’s baseline:
- It begins with CBO’s June 2018 “Long-Term Budget Outlook,” which projects the 2018–48 baseline based on current law.
- Next, CBO’s current-law baseline is converted to a current-policy baseline by assuming that expiring tax cuts and tax moratoriums are made permanent, for reasons explained in the following paragraph.
- Spending on discretionary and smaller mandatory programs level off at their projected 2028 percentage of GDP (which is the final year of CBO’s more detailed 10-year baseline) rather than continue declining indefinitely as a percentage of GDP. Such permanent declines are better classified as a legislative choice rather than the default.[44]
The permanent extensions of recent policy changes do not necessarily reflect this author’s preferences but are based on the idea that the starting baseline should assume the continuation of current policies rather than the (unlikely) future implementation of major changes down the road. And while some budget analysts might aver that CBO’s outlook is based on current law and not on current policy, the reality is that CBO’s current-law baseline already makes an enormous exception: it assumes, per lawmakers’ instructions, that Social Security and Medicare benefits will continue to be paid in full even after the trust funds of both programs are exhausted. A true current-law baseline would show that these benefits would be reduced at that point.
Under an updated, current-policy CBO baseline:
- Federal tax revenues would rise from 16.6% to 18.6% of GDP by 2048.
- Federal spending would jump from 20.6% to 31.5% of GDP.
- Budget deficits would therefore rise from 4.0% to 12.9% of GDP.
- The national debt would jump from 78% to 194% of GDP.
Absent fiscal consolidation, this means that noninterest spending rises from 19.0% to 24.0% of GDP and interest on the national debt rises from 1.6% to 7.5% of GDP.
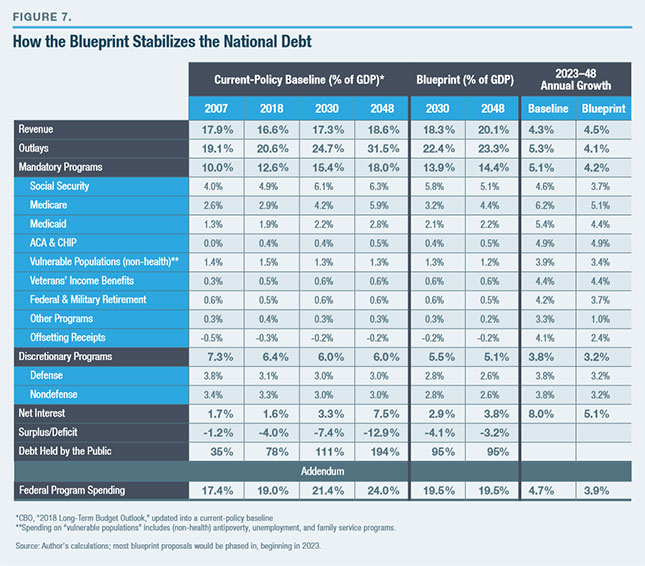
Stabilizing the national debt at 95% of GDP would require tax-and-spending reforms producing net savings against the baseline that gradually rise to 6.0% of GDP annually by 2048:
- This blueprint splits that year’s savings at 4.5% of GDP in spending cuts and 1.5% of GDP in tax increases.
- Over the full 30-year period, the breakdown is 70% spending cuts and 30% tax increases.
- Those reforms would not only directly save 6.0% of GDP annually by 2048; they would also shave 3.7% of GDP off the projected interest spending by that year, as a result of a smaller-than-projected national debt.
The blueprint results in eventually matching spending at 23.3% of GDP, with taxes at 20.1% of GDP. Annual deficits equal to 3.2% of GDP would stabilize the national debt around 95% of GDP (Figure 6).
Yet there is one crucial caveat to keep in mind: the 4.5% of GDP in spending “cuts” is really just a cancellation of the large increases scheduled in the baseline.
Spending on federal programs—which is assumed to average 19.5% of GDP between 2018 and 2022, before the reforms begin—would essentially remain frozen at the level through 2048 (total spending would still rise by 1% of GDP between 2023 and 2048 because of rising interest costs from the normalization of interest rates paid on the national debt).[45]
Furthermore, the 1.5% of GDP in new tax increases would be in addition to the 2.0% of GDP revenue increase that automatically occurs within the baseline as a result of real (CPI-adjusted) bracket creep and the taxes paid on baby boomers’ retirement distributions.[46] Total annual federal revenues between 2018 and 2048 would rise by 3.5% of GDP.
Getting from Here to There: Spending
Stabilizing the ratio of debt to GDP requires annual taxand-spending savings (not including interest on the national debt) that gradually rise to 6% of GDP by 2048. The category of changes is summarized in Figure 7. An explanation of each category lists its 2048 savings against that year’s baseline.
Social Security benefits (1.2% of GDP trimmed from CBO’s 2048 baseline: 6.3%–5.1%). The Social Security Reform Act of 2016, authored by House Ways and Means Social Security Subcommittee chairman Sam Johnson (R., Texas), provides the starting point.[47] While the plan is not perfect, it provides significant long-term savings from wealthier retirees.[48]
Instead of rising from 4.9% to 6.3% of GDP through 2048 in CBO’s baseline, outlays under the Social Security Reform Act would rise to 5.8% of GDP by 2030, before gradually returning to 5.1% of GDP by 2048.[49] By incorporating the 1-percentage-point payroll-tax increase in this blueprint—described below—the Social Security cash deficit through 2048 would fall from $18 trillion to $5 trillion. The system would likely achieve annual balance shortly after 2048.
The parameters of Johnson’s Social Security Reform Act are complicated; yet the vast majority of the federal-budget savings would come from gradually raising the Social Security full-benefit retirement age from 67 to 69 by 2030, and by significantly limiting the growth of benefits for the highest-earning half of new retirees. Initial Social Security benefits would be set lower than under current schedules for those with higher lifetime earnings. Also, seniors whose current (postretirement) incomes exceeded $85,000 (single) and $170,000 (married) in the previous year would not receive a costof-living increase (but this threshold would rise with the inflation rate).
For a couple turning 65 in 2030 with median lifetime earnings, these reforms mean approximately $2,500 less in annual benefits adjusted for inflation. Benefits would be $3,700 lower for a couple with lifetime earnings in the 61st-to-80th earnings percentile and $8,600 for the highest-earning 20% (see Figure 8).[50]
While the Johnson bill would create winners and losers within the bottom 40% of lifetime earners, the formulas could be tweaked to basically hold this population to current scheduled benefits—and thus ensure no cuts to them (not counting the higher full-benefit retirement age). Additional necessary savings to Social Security spending might be found by reforming the inefficient Social Security Disability Insurance program.[51]
These benefit cuts are less drastic than they appear. The Social Security baseline assumes that future retirees will receive much higher benefits than current retirees, even adjusting for inflation. Instead, for all except the top 20% of retirees (by income), someone turning 65 in 2048 would receive an inflation-adjusted benefit roughly equal to (or even slightly above) the benefit level of someone turning 65 in 2018. And only the top 10% of future retirees would see a significant drop in inflation-adjusted benefits relative to 2018 levels.
The specific Social Security formulas can be modified in countless ways. Yet Johnson’s Social Security Reform Act shows that the general approach—raising the full-benefit retirement age and paring back benefits for upper-income retirees (defined both through lifetime earnings and postretirement income)—can save as much as 1.2% of GDP from the 2048 projected spending level. A payroll-tax increase discussed below can bring in an additional 0.36% of GDP. By contrast, CBO estimated that a 2004 proposal to close Social Security deficits primarily through tax hikes would shrink the economy by at least 1.5%.[52]
Medicare benefits (1.5% of GDP trimmed from CBO’s 2048 baseline: 5.9%–4.4%). Medicare spending—projected to more than double, from 2.9% to 5.9% of GDP by 2048—is the single largest driver of longterm deficits. As stated earlier, the Medicare system is projected to run a budget deficit through 2048 of $41 trillion (plus interest). The proposals described below would cut the coming spending increase in half, bringing Medicare spending to 4.4% of GDP by 2048.[53] Medicare would also see a 1-percentage-point payroll-tax increase, as described in the tax section below.
The first place to seek savings is by making Medicare more efficient. The largest efficiencies would come from implementing a premium support system for Medicare Parts A and B, much like the current Medicare Part D (the prescription-drug program), which has cost far less than had been originally projected.[54] Instead of the traditional Medicare system’s one-size-fits-all model (which is slightly improved by the Medicare Advantage option), premium support creates a health-care market where insurers must compete for retirees. This model has proved, in the case of Medicare Part D, to empower seniors, encourage innovation, and reduce premium growth. As applied to Medicare overall, this budget proposal’s federal premium support payment would equal the average bid of all competing plans, all of which would be required to offer benefits at least actuarily equivalent to the current system. CBO estimates that premiums paid by retirees would fall by 7%, and the federal Medicare savings would total 5% of projected Medicare spending by the fifth year.[55] In short, premium support means more choices for seniors, no reduction in benefits, and substantial cost savings both for seniors and the federal government.
In the past, premium support proposals were criticized for tying the payment level to a variable such as inflation or economic growth that may not keep up with the rising cost of health plans—or tying the payment level to one of the lowest-bid plans, thus making it likely that seniors would pay more out-ofpocket for a typical plan. By contrast, the premium support proposal in this report is more generously set at the average local bid. No matter how much healthcare costs rise, the premium support payment would remain tied to the cost of the average plan.
Medicare can achieve additional savings by modestly tweaking other payment policies and curtailing spending such as Graduate Medical Education (GME) subsidies.[56] Overall, efficiency savings could rise to 9% of projected program costs by 2048.[57] The combined annual growth rates of Medicare Parts A and B would fall from approximately 6.3% to 5.8% (and declining).[58]
Once Medicare has maximized its efficiency savings, the next step is to rebalance the responsibility for funding Medicare Parts B and D. Currently, more than 95% of seniors are charged premiums that cover no more than 26% of the cost of their coverage. Taxpayers fund the rest. The federal subsidies for Medicare Parts B and D were not “earned” with earlier payroll taxes— which contribute only to Medicare Part A.
The blueprint gradually raises total senior premiums to cover 50% of Medicare Part B costs—which matches the original program design[59]—and 40% of Medicare Part D costs. The monthly premiums would rise on a sliding scale, based on current, postretirement income. Retirees whose income is at or below the 40th percentile would see no premium hikes. However, the monthly premium would increase between the 41st and 80th income percentile, until it reaches 100% of the cost of the insurance plan. Medicare Part D premiums would still equal just 40% of its program cost because its Low-Income Subsidy (LIS) program decreases or eliminates premiums for many low-income seniors.
These higher premiums will be more affordable because they are partially offset by efficiency gains from the premium support mechanism that should lower total Medicare Part B costs. Once fully phased in, total Medicare premiums would rise by approximately 4% of aggregate senior income relative to the baseline. The “group impacts” section later in this paper breaks down the cost per retired family across incomes.
This blueprint leaves the Medicare eligibility age at 65. CBO estimates that raising the Medicare eligibility age would provide only limited federal budget savings.[60] The small savings are not worth the upheaval.
Overall, these policies are estimated to eliminate half the projected 3.0% of GDP growth of Medicare over 30 years. The expanding retiree population and the persistence of even modest health inflation guarantee the remaining growth. A Medicare payroll-tax increase described below will also bring in 0.36% of GDP. Medicare’s projected 30-year cash shortfall would fall from $41 trillion to $24 trillion through a combination of efficiencies (saving $4.2 trillion), Part B premium income-relating (saving $5.9 trillion), Part D premium income-relating (saving $2.6 trillion), and a payroll-tax increase (raising $4.0 trillion).[61]
These reforms likely maximize Medicare’s conceivable budget savings. Not much more can be saved from income-relating Medicare premiums without severely burdening the bottom 40% of earners.[62] For those who consider these efficiency savings timid, saving another 0.5%–1.0% of GDP on efficiencies would require savings of 20%–30% below the 2048 spending projections—a worthy goal that should not be assumed.[63]
Medicaid (0.6% of GDP trimmed from CBO’s 2048 baseline: 2.8%–2.2%). Recent eligibility expansions and natural caseload increases have raised federal Medicaid spending from 1.3% to 1.9% of GDP since 2007—and spending is projected to reach 2.8% of GDP within 30 years. Achievable reforms can instead limit that growth to 2.2% of GDP while improving the program.[64]
Congress should first address the 90% long-term federal reimbursement rate for the newly eligible population of nondisabled, working-age adults with higher incomes that were implemented in 2014. States should continue to be allowed to include these newly added adults in their Medicaid programs; but no rational explanation exists for Washington subsidizing nondisabled, working-age adults on Medicaid with a much higher reimbursement rate than children, the elderly, and the disabled. This higher federal reimbursement rate is currently in the process of dipping from 100% to 90% between 2016 and 2020. Congress should gradually repeal this higher reimbursement rate.
This blueprint would cap Washington’s per-capita Medicaid payments to states, beginning in 2023.[65] The current system irrationally reimburses a preset percentage of state Medicaid costs, which means that the more a state spends, the larger its federal subsidy. The current system also restricts state innovation in health care, such as health savings accounts (HSAs). Per-capita caps would provide an incentive and the added flexibility for states to devise innovative coverage for low-income residents. States developing successful approaches will certainly be copied by other states.[66]
In keeping with the principle that deficit reduction should not simply dump the federal budget deficit onto states, the per-capita caps would be significantly looser than those proposed by Senate Republicans in 2017. They proposed limiting the annual growth rate of the per-capita caps to the CPI-U (Consumer Price Index for All Urban Consumers, currently projected at 2.4%) when fully phased in. By contrast, this blueprint would allow the caps to grow by 3.5% annually for children and adults; and 4.0% annually for the elderly and disabled (a weighted average of 3.8%). This is not far below the estimated 4.6% annual growth in per-capita Medicaid spending assumed in CBO’s long-term budget baseline. Innovative governors should be able to stay under these more generous caps without raising state taxes or deeply limiting eligibility.
Overall, under this blueprint, federal Medicaid spending would rise from 1.9% of GDP in 2018 to 2.2% of GDP in 2048—significantly slower growth than under CBO’s baseline, which rises to 2.8%. Still, federal Medicaid spending is likely to grow somewhat faster than the economy because the annual growth of proposed per-capita spending (3.8%) plus the Medicaid population (0.6%) will likely exceed the 4.0% projected annual growth of the nominal GDP that is projected by CBO in its 30-year baseline. While the federal government could save another 0.5% of GDP off the projected 2048 total by capping annual growth at 2.5% for all populations, it is unlikely that governors could bring per-capita cost growth down near the CPI. Thus, governors would strongly resist such tight federal caps, and the added federal savings would most likely translate into state tax increases, anyway.
ACA and CHIP. No cost changes. Health spending on Affordable Care Act (ACA) subsidies and the Children’s Health Insurance Program (CHIP) are projected to gradually rise from 0.37% to 0.46% of GDP during 2018–48 because of rising per-capita health costs. ACA has many flaws, but any reforms or replacement would likely involve a similar level of spending. As far as the national debt–GDP ratio is concerned, even somehow cutting the cost of ACA by 25% would save just 0.1% of GDP by 2048.
Other mandatory programs (0.3% of GDP trimmed from CBO’s 2048 baseline: 2.5%–2.2%). To avert deeper Social Security and Medicare reforms, some budget proposals vaguely assume that antipoverty and other mandatory federal programs can be dramatically cut from 2.6% of GDP down to 1% or even lower. This blueprint instead gradually trims other mandatory spending to 2.2% of GDP by 2048. It allows spending to grow at CBO’s baseline level through 2028, and then 3.3% annually thereafter—slightly faster than the projected rate of chained CPI inflation (2.2%) plus population growth (0.6%).[67]
There is no politically realistic path to achieving major savings from this slice of federal spending—which includes benefits to vulnerable populations (50%), veterans (20%), and federal and military retirees (20%).
Spending on “vulnerable populations” consists of 1.5% of GDP spent on—in order of costs—SNAP (aka food stamps), the Earned Income Tax Credit (EITC), Supplemental Security Income (SSI), unemployment benefits, child nutrition programs, child tax credit outlays, adoption assistance, Temporary Assistance for Needy Families (TANF), child-care assistance, and other similar programs. Even the most aggressive SNAP work requirements would save perhaps 0.1% of GDP, and recent legislative history shows that EITC and the child tax credit will more likely be expanded rather than pared back. True enough, a more effective welfare system would devolve much of its spending to states; but shifting the address where taxes are mailed should not count as a major deficit reduction or savings to taxpayers. Limiting this spending growth to 3.3% annually beyond the 2018–28 CBO baseline would gradually lower it by 0.3% of GDP by 2048. This growth rate would be achieved by simply allowing per-capita benefits to grow with the inflation rate, while leaving additional room for faster-growing SSI and child nutrition program costs. Limiting federal overpayments to beneficiaries can also provide budget savings of an indeterminate amount.
Nearly half of “other mandatory” spending consists of veterans’ compensation and pensions (0.5% of GDP), military pensions (0.2% of GDP), and federal employee pensions (0.3% of GDP). Recent wars and the aging of the population will increase these costs. Congress understandably will not rein in benefits for veterans’ and military personnel, and even reforms of the federal employees’ pension system would likely be phased in slowly. After staying on CBO’s baseline through 2028, the blueprint assumes that veterans’ income benefits and military retirement benefits will grow 4.0% annually, while federal retirement costs will expand at a 3.2% clip.
The remaining 10% of mandatory program spending includes farm subsidies, student loans, and several other federal insurance and loan programs. The blueprint assumes that these programs will expand at annual rates of 1.0%–3.2% after 2028. This category of spending could also achieve significant offsets by privatizing or terminating lower-priority programs, scaling back wasteful farm subsidies, or selling excess federal land and assets. These savings could finance stronger growth in veterans’ benefits or an expanded EITC.
Discretionary programs (0.9% of GDP trimmed from CBO’s 2048 baseline: 6.0%–5.1%). Like “other mandatory spending,” discretionary spending is often a magnet for unrealistic budget-cutting proposals. Liberals often overestimate plausible defense cuts, while conservatives go overboard on unspecified nondefense cuts.
Discretionary spending is currently 6.2% of GDP (plus 0.2% of GDP for hurricane relief) and headed toward 6.0% within a few years; this blueprint proposes a gradual fall to 5.1% of GDP through 2048. Annual appropriations in nominal dollars would grow by 2.5% through 2030, and 3.5% thereafter—a little faster than projected chained CPI inflation (2.2%) plus population growth (0.6%).
This blueprint proposes to maintain parity between defense and nondefense spending levels—as a bipartisan compromise and an acknowledgment that neither category can be reduced as deeply as partisans on either side wish.
It is fashionable in some quarters to criticize America’s “outlier” defense budget and advocate spending closer to the 2% of GDP targeted by major European allies. However, the U.S. has already moved substantially in that direction. After topping 9% of GDP during the Vietnam War, defense spending averaged 6% under President Reagan, before the end of the Cold War dropped defense spending to 2.9%. The wars in Iraq and Afghanistan briefly pushed defense spending as high as 4.7% of GDP; yet it has since fallen back to 3.1%.[68] This blueprint’s assumed annual growth rates of 2.5%–3.5% would eventually trim defense spending to 2.6% of GDP (the lowest level since the 1930s).[69] The Pentagon should be able to absorb a gradually lower percentage of GDP as long as annual spending can keep up with the cost of equipment and compensation. Deeper cuts would face bipartisan opposition from defense experts and from lawmakers who do not wish to surrender America’s status as a military superpower or slash troop compensation levels.
Nondefense discretionary spending is currently 3.1% of GDP (plus 0.2% in temporary disaster relief from recent major hurricanes), on the bottom end of the 3.1%–4.0% range that has prevailed for 35 years. The proposed 2.5%–3.5% annual growth rate—enough to slightly exceed inflation plus population growth—will nonetheless gradually bring spending down to 2.6% of GDP because the economy is projected to grow slightly faster than these appropriations.[70]
Conservative blueprints, as well as President Trump’s Fiscal Year 2019 budget proposal, seek to eventually decrease nondefense discretionary spending from today’s 3.1% down to 1% of GDP. In reality, neither party would likely consider drastic cuts to veterans’ health care, highways and infrastructure, K–12 education, homeland security, and the National Institutes of Health. Whatever the merits of targeting the National Endowment for the Arts, public broadcasting, and congressional salaries, they are of vanishingly small budgetary consequence— about 0.005% of GDP. Many nondefense discretionary programs are candidates for devolution to states; yet those savings should not count as a major deficit reduction if they simply result in additional state taxes or deficits.
To be sure, permanently capping the growth of discretionary spending growth at 2.8%—which is the projected chained CPI inflation rate plus population growth—could save an additional 0.5% of GDP annually by 2048. The hitch: it would leave little room for the steeply rising cost of veterans’ health care. It would also limit new initiatives for infrastructure, border security, health research, or even space exploration. It would also limit America’s response to a national security threat. Tight discretionary caps are feasible for perhaps a decade, but it is unlikely that Americans will put all other major government initiatives on hold for 30 years, solely to maximize Social Security and Medicare benefits.
Getting from Here to There: Taxes
Relative to an updated, current-policy CBO baseline, the spending reforms in this blueprint would produce budget savings equal to 4.5% of GDP annually by 2048. To reach the blueprint’s overall 6.0% of GDP in noninterest savings, the final 1.5% must come from new taxes.
A current-policy CBO baseline already assumes—even if the 2017 tax cuts are made permanent—that revenues will still jump by 2% of GDP over this period because of real (CPI-adjusted) bracket creep and the deluge of taxable retirement distributions from retiring baby boomers.[71] So the 1.5% of GDP tax hike proposed in this blueprint would bring the total 2018–48 revenue increase to 3.5% of GDP (compared with a 0.5% of GDP increase in noninterest spending over that period).
The 1.5% of GDP in proposed legislative tax hikes consists of:
- Phasing down the tax exclusion for employer-provided health care, yielding additional revenue of 0.72% of GDP by 2048
- Raising the Medicare and Social Security payroll tax by 1 percentage point each, while adding a 1-percentage-point income-tax surcharge above the level where the Social Security tax on earnings maxes out, yielding additional revenue equal to 0.73% of GDP
- Allowing various “December tax extenders” to be offset or expire, yielding additional revenue equal to 0.05% of GDP.
Starting in 2023, the employer health-care tax exclusion would be capped at the 75th percentile of health-insurance premiums paid by employers that year (replacing the Obamacare “Cadillac tax” that was never implemented). The cap level setting a maximumdeductible premium would then grow annually at the rate of the CPI.[72] Capping the exclusion will reduce business incentives to overspend on health benefits and to downplay cost containment, and thus contribute to broader efficiency savings in health care. It will also increase take-home pay for many workers because more of their compensation would go toward wages rather than health-insurance premiums. The exposure of more employee compensation to payroll and income taxes means more revenue collected by the federal government—under this proposal, equal to 0.20% of GDP by 2028 and 0.72% by 2048.
Raising the Social Security and Medicare payroll tax by 1 percentage point each is recommended for two reasons.[73] First, as stated above, the Social Security and Medicare systems face a combined $100 trillion cash deficit over 30 years, so it makes sense to concentrate budget savings in those two systems. Second, any tax increases should be widely dispersed to minimize economic disruptions. The alternative of imposing enormous tax hikes on one industry or group of people would significantly decrease incentives to work, save, and invest, and thus harm economic growth—which would also decrease the resulting new tax revenues. A simple 2-percentage-point payroll-tax increase, split between Social Security and Medicare, will affect nearly all workers while crippling very few. The Social Security payroll tax maxes out at a certain income level ($128,700 in 2018); the blueprint proposes adding a 1-percentage-point tax to income above that level so that the new tax remains proportional.[74]
Those who would prefer that all new taxes come from upper-income taxpayers should note that these taxpayers would already bear nearly the entire cost of 3% of GDP in Social Security and Medicare reforms—as well as most of the cost of scaling back the employer health exclusion. Replacing the 2-percentage-point increase on the Social Security and Medicare payroll tax with a 20-percentage-point income-tax hike on families earning above $400,000 would raise a similar amount of revenue yet significantly damage the economy and raise equity concerns. Alternatively, eliminating the 12.4% Social Security earnings cap (raising 0.8% of GDP) would combine with the benefit changes described above to leave Social Security with a large surplus and Medicare with an enormous deficit, while also pushing combined federal and state marginal tax rates as high as 62%. Under this blueprint, the bottom-income 40% of retirees would already see no reduction in Social Security benefits formulas and no hike in Medicare premiums—and there are no significant cuts to antipoverty or social spending. For many who are working, the modest payroll-tax increase would be their only cost of this substantial fiscal consolidation, beyond a future higher Social Security full-benefit retirement age.
Sticking to the Blueprint
To maintain a balance between tax and spending changes, lawmakers would need to codify the spending and tax proposals in this blueprint with 30-year targets. Every five years, lawmakers should be required to ensure that Social Security, Medicare, Medicaid, and tax revenues each remain on their original 30-year path, and to enact further reforms for any category whose savings are not materializing.[75] Failure to return any veering categories to their preset path would trigger automatic reforms to the given category. PAYGO laws and statutory discretionary spending caps can help keep the rest of the budget on its preset path. Statutory caps would be useful because they would reflect a bipartisan consensus and specific underlying reforms.
If lower deficits should emerge—such as from higher tax revenues, thanks to faster economic growth or lower health-care spending due to more expanded efficiencies—lawmakers should first be required to offset any recent budgetary losses from recessions or emergency spending. Once that is done, the next 1% of GDP in savings should remain unspent as a down payment on future emergencies or recessions. Only after that should lawmakers consider temporary new tax cuts or spending increases. Congress should avoid enacting permanently expensive policies in response to temporary savings windfalls, especially considering that even with a stabilized debt, the annual budget will still be in deficit.
Group Impacts
Seniors. Well-off retirees will shoulder most of the costs of bringing Social Security and Medicare finances to a sustainable level. The wealthiest half of seniors often have incomes and net worths (even excluding illiquid home equity) that exceed those of young workers, while typically not having mortgage or child-raising expenses.[76]
Figure 8 shows the costs of Social Security and Medicare reforms at various retirement income levels in the future. Incomes include Social Security benefits and retirement distributions, and all figures are adjusted for inflation.[77] For Social Security, figures assume that the individuals turn 65 in the listed year.
- Seniors with household incomes below the 40th percentile would see no change in Social Security benefit formulas (only a higher full-benefit retirement age) and would benefit from lower Medicare premiums due to premium support efficiencies.
- Seniors in the 41st –60th income percentile—with an average household income of $52,500 in 2030— would face approximately $2,500 less in annual Social Security benefits and $1,050 in higher Medicare premiums.[78] This 7%-of-income cost would rise to roughly 9% by 2048.
- Seniors in the 61st –80th income percentile—with an inflation-adjusted average household income of $91,000 in 2030—would face approximately $3,700 less in annual Social Security benefits and $6,300 in Medicare changes, totaling 11% of their income (and rising to 14% by 2048). This burden would not be easy, although the retirement income of this group would well exceed the income of many families that would otherwise be taxed to finance their benefits.
- Retirees in the 81st –100th income percentile— with average household incomes of $280,000 by 2030 (and a median income of $165,000) would experience a decline in their Social Security benefits of $8,600 and a rise in Medicare premiums of $11,000. This would average 7% of their income in 2030, rising to 9% by 2048. While this group would pay the highest reform price when measured in dollars, even paying the maximum 100% of their Medicare Part B and D premiums would not represent a high percentage of their income—which limits their overall reform burden relative to other income quintiles.
As stated earlier, these figures may overstate the effect of the Social Security cuts because they are measured against a baseline in which future retirees would receive much higher benefits than current retirees, even adjusting for inflation. Under the proposed reforms, the vast majority of future retirees would still receive inflation-adjusted benefits equal to or slightly greater than those turning 65 in 2018.
To a degree, the costs of the blueprint’s changes to upper-income retirees (both current and future) could be mitigated by expanding 401(k) contribution limits and by further encouraging auto-enrollment and contribution auto-escalation of employer retirement accounts. Eliminating the Social Security payroll tax for workers age 62 and older (or, alternatively, those with 40 years of work experience) would encourage seniors who wish to stay in the workforce and essentially subsidize employers who hire them.[79] However, the cost of any of these reforms would require budgetary offsets.
Working-age adults. To improve generational equity, this blueprint largely shields working families from what would otherwise be the largest intergenerational wealth transfer in world history. Wage earners would experience only a small payroll-tax hike, a gradual capping of the tax exclusion for employer-provided health-insurance premiums, and social programs growing at a slightly slower pace than the economy. Compared with the alternative of a 34% VAT or 33% payroll tax—which would cost economic growth as well as direct taxes—this blueprint provides a much more affordable outcome for working families.

The poor. This blueprint resists the common conservative tactic of assuming large and unrealistic cuts in antipoverty spending. From the perspective of good public policy, significant antipoverty reforms are needed to encourage work and opportunity. From the perspective of the federal budget, most realistic reform proposals do not provide significant savings, especially up front. For that reason, and despite large reductions elsewhere, this blueprint recommends that total federal spending on poverty programs remain indefinitely at 3.9% of GDP.[80] Spending on health care for poor people would rise to 2.3%–2.7% of GDP by 2048. Nonhealth antipoverty spending would slightly surpass the levels required to continue all programs at their baseline growth rates—but its share of GDP would gradually decline from 1.6% to 1.2% because the economy typically grows faster than these programs’ populations and benefits (which typically grow by CPI inflation).[81] Total antipoverty spending would still exceed the percentage of GDP levels of the 1970s, 1980s, and 1990s.[82] Given the size of the fiscal consolidation proposed in this blueprint, it is fair to say that the safety net will be well protected.
State and local governments. Deficit reduction should not simply mean shifting taxes and debt onto state and local governments. This blueprint proposes Medicaid per-capita caps at levels that governors should be able to absorb within their existing budgets. It also assumes that most grant programs to state and local governments will grow by the inflation rate or even faster. Many state and local governments have their own unsustainable pension costs to tackle, and this blueprint avoids overburdening them with significant new costs.
IV. In Defense of the Plan
Answering Conservative Critics
At first glance, many conservatives will dismiss the proposals in this report as overly timid. Specifically, raising taxes by 1.5% of GDP rather than aggressively lowering antipoverty and nondefense discretionary spending may be considered a weak-kneed surrender to big government.
Instead, it is an acknowledgment of political reality. State governors will not accept or absorb Medicaid caps that grow no faster than the inflation rate. ACA will not likely be replaced with nothing, as proved in 2017. The 1.5% of GDP spent on non-health antipoverty entitlements— which includes conservative-supported policies like the refundable EITC and child credit, as well as generally untouchable programs like child nutrition and SSI—can gradually decline as a share of the economy, but they will not be eliminated or even halved in any foreseeable political future. Other mandatory and nondefense discretionary spending is dominated by veterans’ income and health benefits, military and federal pensions, unemployment benefits, highways and infrastructure, the National Institutes of Health, homeland security, disaster relief, and K–12 funding. They are here to stay.
The argument of this blueprint, simply put, is that 4.5% of GDP represents the likely outer bounds of plausible long-term spending cuts relative to the 2048 baseline—and that the voting public would not accept the additional 1.5% of GDP evisceration of the safety net and domestic spending just to keep tax increases completely off the table.
This blueprint essentially freezes federal program spending at the 19.5% of GDP (Figure 7) 2018–22 pre-reform average, despite 74 million Americans retiring into Social Security and Medicare and despite rising health-care costs. It is easy to come up with a “conservative dream budget” that would show greater spending savings. But even a hypothetical Republican congressional supermajority would find it politically suicidal to fully overhaul Social Security and Medicare without Democratic buy-in. The political model should be the bipartisan 1983 Social Security reforms, not the 2010 ACA.
Conservatives are in an especially perilous position. Delay likely guarantees that an eventual budget deal will be increasingly tax-heavy. Each year, 4 million more baby boomers retire, while Social Security and Medicare benefits automatically increase—essentially closing the window on reforming those programs. Additionally, delays bring permanently higher interest costs on the growing national debt. Together, these two developments mean that the savings needed to stabilize the budget will continue escalating at exactly the time when baby-boomer retirements and rising benefits make Social Security and Medicare more difficult to reform.
Consequently, if lawmakers wait another five to 10 years, they will likely have missed the window on entitlement reform, and tax increases including a 15%–20% VAT will become nearly inevitable. This VAT would probably be enacted at a low 1%–2% rate, but—like the income tax a century earlier—would quickly grow into a massive federal cash machine to finance continued government expansions.
It is no longer possible to stabilize the national debt with revenues at 17%–18% of GDP. Conservatives can either concede 1.5% of GDP in limited, broad-based taxes now—and begin concentrating spending reforms on wealthy seniors rather than vulnerable populations—or wait 10 years and end up with a European-size VAT.
Answering Liberal Critics
Many liberals will also dismiss this proposal at first glance. Medicare premium support, significant income-relating of Social Security and Medicare benefits, and state Medicaid per-capita caps may be considered nonstarters—especially when paired with just 1.5% of GDP in tax increases that are not limited to “millionaires.”
However, tax hikes on upper-income earners and defense cuts alone cannot close a budget gap equal to 6% of GDP by 2048. Even raising the top four income-tax brackets (currently 24%, 32%, 35%, and 37%) to 30%, 40%, 50%, and 70% would raise just 1.6% of GDP (or lower when deducting lost revenues to macroeconomic effects), while leaving little room to expand the 12.4% Social Security tax to higher earnings. Restoring the developed world’s highest corporate-tax rate would raise, at most, 0.7% of GDP. Proposals popular on the left to significantly raise taxes on capital gains, banks, hedge funds, multinational corporations, and oil and gas companies would barely register in the long-run accounting. The unforgiving budget math shows that heading off a debt crisis mostly through taxes must require a huge burden on the middle class. Even a 15% VAT—which is anything but progressive—would raise just 2.6% of GDP.[83]
Nor will other fashionable ideas put the long-term budget on a sustainable path. The blueprint already assumes that defense spending eventually falls to 2.6% of GDP for the first time since the 1930s. Single-payer health care has been scored as adding nearly $30 trillion in federal spending over the decade—and even somehow converting all current family, business, and state government health savings into a “single-payer tax” to finance the initiative would still merely break even from a budgetary perspective.[84] It would not significantly affect Medicare’s projected $41 trillion shortfall.
Significant savings to the federal budget must come from the spending side. Who should bear the burden? Presumably, protecting low-income families and discretionary social spending are top liberal priorities. Defense spending is already projected to continue falling. That leaves health-care inefficiencies and welloff seniors to provide the remaining spending savings. For liberals who believe that “the rich” should pay their “fair share,” trimming their large Social Security benefits and Medicare subsidies accomplishes the same redistribution as raising upper-income taxes, but without the economic damage. Furthermore, paring back their benefits avoids the intergenerational redistribution of burying today’s workers in taxes to finance baby-boomer benefits. Within a decade, the wealthiest half of seniors—in other words, the wealthiest members of the wealthiest age group—will otherwise collect $300 billion in annual Medicare Part B and D subsidies that were never earned with payroll taxes. That would exceed total federal antipoverty outlays on SNAP, EITC, SSI, child nutrition, and the child tax credit.
The Medicare-premium support policy proposed here is generously set at the level of funding of the average-bid plan, rather than more common second-lowest bid proposals. The premium support concept itself has achieved bipartisan support through the 1999 National Bipartisan Commission on the Future of Medicare (Breaux-Thomas) and the Bipartisan Policy Center’s 2010 Debt Reduction Task Force (Domenici-Rivlin)— and has much in common with ACA’s health exchanges.[85] The Medicaid per-capita caps are much looser than the 2017 Senate Republican proposal and would not likely force politically unacceptable cuts. ACA and antipoverty spending benefits are maintained; discretionary spending would continue to see parity between the defense and nondefense sides.
On the tax side, the 30-year baseline already assumes that tax revenues will rise by 2% of GDP due to real (CPI-adjusted) bracket creep and taxable retirement distributions, even if the 2017 tax cuts are extended. Adding a 1.5% of GDP tax increase will bring revenues above 20% of GDP on a sustained basis for the first time in American history.[86] Between 2018 and 2048, tax revenues would rise by 3.5% of GDP while noninterest spending would rise by 0.5% of GDP.
The payroll-tax hike in the blueprint will affect all working Americans. But upper-income Americans would already be absorbing most of the Social Security and Medicare benefit cuts, as well as the proposed limitations on the employer-based health-tax exclusion.
Finally, if liberals propose an expensive new initiative down the road, such as tuition-free public universities or universal pre-K, they will not have already used up all their realistic tax hikes on Social Security and Medicare benefits for wealthy seniors.
Conclusion
For decades, economists and policy experts warned that a budgetary and economic tsunami would come when the 74 million baby boomers retire into Social Security and Medicare. Nevertheless, a parade of presidents and Congresses did nothing to avert the crisis. To the contrary, both parties added a new Medicare drug entitlement in 2003, after which the Affordable Care Act further expanded federal health obligations for Medicaid and new subsidized health-insurance exchanges.
Today, one-third of the baby boomers have already retired, and another one-third will retire over the next six years. Annual budget deficits will soon pass $1 trillion on the way to $2 trillion and possibly $3 trillion in 10–15 years. Overall, the Social Security and Medicare systems face an unfathomable $100 trillion cash deficit over 30 years.
Without reform, runaway deficits will all but guarantee a debt crisis that will profoundly damage the country’s economic and social order. There is still time to avoid that crisis, but it will require the nation’s fractious political leaders to leave their respective comfort zones and compromise.
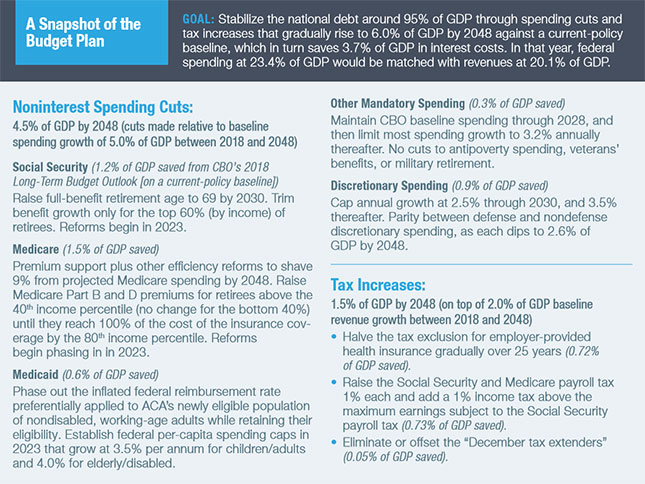
Endnotes
- Brian Riedl, “America Might Be Ready for Democratic Socialism. It’s Not Ready for the Bill,” Vox.com, Aug. 7, 2018.
- Congressional Budget Office (CBO), “The Budget and Economic Outlook: 2018 to 2028,” Apr. 9, 2018, projects federal spending rising by approximately $150 billion per year over the decade.
- CBO, “H.R. 3, Spending Cuts to Expired and Unnecessary Programs Act,” cost estimate, June 7, 2018. The strongest opposition, particularly in the Senate, centered on a proposed rescission of $7 billion from the Children’s Health Insurance Program (CHIP), which CBO showed would never have been spent anyway.
- The debt held by the public generally refers to debt funded by borrowing from the public. It does not include intragovernmental debt, such as the Social Security trust fund.
- Baseline estimates come from CBO’s 10-year baseline, “The Budget and Economic Outlook: 2018 to 2028,” and the 30-year baseline, “The 2018 Long-Term Budget Outlook,” June 26, 2018, with supplemental tables at https://www.cbo.gov/system/files?file=2018-07/51119-2018-06-ltbo.xlsx. For this report, CBO’s figures have been converted from a current-law to a current-policy baseline by assuming that all expiring tax cuts are instead made permanent and that discretionary and “other mandatory” spending is frozen for the 2029–48 period at CBO’s projected 2028 levels of 6.0% and 2.5% of GDP, respectively. Budget savings from the reforms proposed in this report are scored using models built from CBO data and Social Security and Medicare trustee data—and are available from the author upon request. CBO’s baseline also assumes that Social Security and Medicare will continue paying full benefits even after their trust funds are exhausted.
- One of the more influential studies is Thomas Laubach, “New Evidence on the Interest Rate Effects of Budget Deficits and Debt,” Board of Governors of the Federal Reserve System, May 2003.
- CBO’s 30-year baseline assumes that—despite a debt reaching 150% of GDP—the average interest rate on the debt never exceeds 4.4%. Yet that figure is even lower than the average rate of 6.9% in the 1990s and 10.5% in the 1980s.
- CBO, “The 2018 Long-Term Budget Outlook,” June 26, 2018, with supplemental tables at https://www.cbo.gov/system/files?file=2018-07/51119-2018-06-ltbo.xlsx.
- C. Eugene Steuerle and Caleb Quakenbush, “Social Security and Medicare Lifetime Benefits and Taxes,” Urban Institute, Sept. 16, 2015. Figures in the text reflect Steuerle and Quakenbush’s table 15 for a married couple with two average earners ($95,600 in 2015 dollars).
- See note 2.
- CBO, “The Budget and Economic Outlook: 2018 to 2028.”
- CBO, “An Analysis of the President’s 2019 Budget,” May 24, 2018.
- Calculated from CBO, “The Budget and Economic Outlook: 2018 to 2028.”
- CBO, “The Budget and Economic Outlook: 2018 to 2028”; idem, “The 2018 Long-Term Budget Outlook.”
- CBO, “The Budget and Economic Outlook: 2018 to 2028.”
- For an overview of the research on realistic productivity rates, see Committee for a Responsible Federal Budget, “How Fast Can America Grow?” May 18, 2017.
- Adding 0.6% to the annual economic growth rate would produce an additional $132 trillion in cumulative GDP for 2018–48, which translates to roughly $26 trillion in tax revenues and $9 trillion in interest savings on the national debt.
- One of the more influential studies is Laubach, “New Evidence on the Interest Rate Effects of Budget Deficits and Debt.”
- Calculated using CBO, “The 2018 Long-Term Budget Outlook,” June 26, 2018, and supplemental tables at https://www.cbo.gov/system/files?file=2018-07/51119-2018-06-ltbo.xlsx, and adjusting into a current-policy baseline.
- A much-hyped CBO report (“S. 744 Border Security, Economic Opportunity, and Immigration Modernization Act,” June 18, 2013) showed overwhelmingly positive budgetary effects of immigration legislation that would both increase immigration levels and provide legal status to a large number of unauthorized immigrants. The score limited most of its analysis of federal taxes and spending over 20 years. It ignored significant state and local government costs as well as longer-term Social Security and Medicare costs.
- CBO, “The Budget and Economic Outlook: 2018 to 2028.”
- In 2018, antipoverty spending equals 4.0% of GDP, while nondefense discretionary spending is 3.3%.
- The spending function tables accompanying Trump’s FY 2019 budget proposal employ what is essentially an enormous “cuts to be determined” line item to meet its proposed discretionary spending caps. See Office of Management and Budget (OMB), “Budget of the United States Government, Fiscal Year 2019,” table 26-1: Net Budget Authority by Function, Category, and Program,” row 1163, February 2018.
- See Scott Hodge, “News to Obama: The OECD Says the United States Has the Most Progressive Tax System,” Tax Foundation, Oct. 29, 2008. Even those figures underestimate this country’s current tax progressivity advantage because they do not include the 2013 upper-income tax increases and, more important, do not include the large value-added taxes that make European tax systems even less progressive.
- Calculated using IRS, “SOI Tax Stats—Individual Statistical Tables by Size of Adjusted Gross Income,” table 1.4. In 2015, the amount of income earned over the $500,000 threshold approximated 7.8% of GDP. An estimated 2.7% of GDP was paid in federal and state taxes on this income, leaving 5.1% of GDP in available take-home pay.
- See Figure 5 for the revenue estimates of several popular tax proposals. CBO estimates that these proposals would raise $23.3 billion annually by 2026, on a static basis. However, budget sensitivity tables estimate that a sustained 1-percentage-point decline in real economic growth would cost the federal budget $472 billion annually by 2026. Thus, if these new taxes reduce economic growth by even 1/20 of 1%, revenues would fall by $23.6 billion—enough to negate the tax-increase revenues. See OMB, An American Budget: Analytical Perspectives, “Economic Assumptions and Interactions with the Budget,” table 2-4: Sensitivity of the Budget to Economic Assumptions, February 2018.
- CBO, “The Distribution of Household Income, 2014,” Mar. 19, 2018. Supplemental data are at https://www.cbo.gov/system/files/115th-congress-2017-2018/reports/53597-....
- CBO, “The Distribution of Household Income and Federal Taxes, 2013,” June 8, 2016. Supplemental data are at https://www.cbo.gov/sites/default/files/114th-congress-2015-2016/reports....
- The Joint Committee on Taxation (JCT) scored Title II (business tax reform) and Title III (international tax reform) of TCJA as costing $329 billion over the decade. However, JCT separately shows that the tax bill would provide $385 billion in total growth revenues. The economic consensus assumes that most of this growth comes from the bill’s corporate reforms, rather than the individual reforms. Thus, the corporate tax cuts in TCJA are almost entirely “paid for” with offsets such as reduced deductions (such as those for interest paid) and growth revenues. See JCT, “Estimated Budget Effects of the Conference Agreement for H.R. 1, the Tax Cuts and Jobs Act, Fiscal Years 2018–27,” Publication JCX-67-17, Dec. 18, 2017; JCT, “Macroeconomic Analysis of the Conference Agreement for H.R. 1, The ‘Tax Cuts and Jobs Act,’ ” Publication JCX-69-17, Dec. 22, 2017.
- Calculated using tax estimates in Figure 5.
- CBO, “Costs of Military Pay and Benefits in the Defense Budget,” November 2012, p. 2.
- Charles Blahous, “The Costs of a National Single-Payer Healthcare System,” Mercatus Working Paper, Mercatus Center at George Mason University, July 2018.
- John Holahan et al., “The Sanders Single-Payer Health Care Plan: The Effect on National Health Expenditures and Federal and Private Spending,” Urban Institute, May 9, 2016.
- Charles Blahous, “Questions and Answers About Medicare for All’s Costs,” Economics21, Aug. 21, 2018.
- For an example of this argument, see Dylan Scott, “Bernie Sanders’s $32 Trillion Medicare-for-All Plan Is Actually Kind of a Bargain,” Vox.com, July 30, 2018.
- Brian Riedl, “No, ‘Medicare for All’ Is Still Not Plausible,” Economics21, Aug. 10, 2018.
- For more on the unworkability of a single-payer system in the U.S., see Sally Pipes, The False Promise of Single-Payer Health Care (New York: Encounter, 2018); Richard A. Epstein, “Why a Single Payer Health Care System Is a Really Bad Idea,” Newsweek, July 18, 2017; Brian Riedl, “America Needs Health-Care Reform, and Single-Payer Will Be No Part of It,” National Review Online, Aug. 15, 2017; Chris Pope, “Bernie’s Bad Medicine,” National Review Online, Oct. 16, 2017.
- This argument is most commonly associated with the talking point that Social Security is “fully funded” through 2034. Yet it is fully funded only because taxpayers will be repaying trillions to the Social Security trust fund over that period. These general revenue transfers will burden taxpayers and force up budget deficits each year.
- Calculated using CBO, “The 2018 Long-Term Budget Outlook,” June 26, 2018, and supplemental tables at https://www.cbo.gov/sites/default/files/recurringdata/51119-2018-06-ltbo....
- While some—such as the Social Security Administration—display reform options against the general target of 75-year solvency, in practice that often means decades of crushing deficits balanced by decades of large surpluses. Yet basic intergenerational equity rejects having one generation run surpluses to balance another generation’s deficits.
- See U.S. Census Bureau, “Wealth, Asset Ownership, & Debt of Households Detailed Tables: 2013,” 2017. Senior citizens (age 65 and older) have the largest net worth of all age groups (median $202,950), but even excluding illiquid home equity, their average net worth exceeds all age groups except 55–64. Additionally, seniors average nearly the same post-tax, post-transfer income as the broader population, while having lower child and mortgage expenses. See CBO, “The Distribution of Household Income and Federal Taxes, 2013,” June 8, 2016, and supplemental tables 7 and 13 at https://www.cbo.gov/sites/default/files/114th-congress-2015-2016/reports....
- If current Social Security participants were held harmless from full solvency reforms, those now entering the workforce would experience net income losses through the program of 3.8% of their lifetime wages. See Charles P. Blahous III and Robert D. Reischauer, “A Preview of the 2018 Social Security and Medicare Trustees’ Reports,” Bipartisan Policy Center, May 2018. The long-term Medicare shortfall is even larger.
- Andrew G. Biggs, Kevin A. Hassett, and Matthew Jensen, “A Guide for Deficit Reduction in the United States Based on Historical Consolidations That Worked,” American Enterprise Institute, December 2010.
- CBO, “The Budget and Economic Outlook: 2018 to 2028.”
- CBO’s 30-year, long-term budget baseline assumes that—despite a debt reaching 150% of GDP—the average interest rate paid on the debt never exceeds 4.4%. The average rate was 6.9% in the 1990s and 4.8% of the 2000s.
- Real bracket creep is the phenomenon where incomes rise faster than inflation and push families into higher tax brackets, which thereby increases tax revenues faster than the inflation rate.
- The Social Security Reform Act is H.R. 6489 in the 114th Congress.
- For a summary of the Social Security Reform Act, see Committee for a Responsible Federal Budget, “Johnson Introduces Social Security Solvency Legislation,” Dec. 9, 2016.
- The Johnson bill is scored by the Office of the Chief Actuary, Social Security Administration (SSA); “Letter to the Honorable Sam Johnson,” Dec. 8, 2016, table 1C, p. 29, scores the legislation against SSA’s baseline. However, the blueprint in this report is scored against CBO’s baseline. Applying the SSA-scored annual savings to CBO’s Social Security baseline is an admittedly imperfect technique but does provide a general estimate of the bill’s CBO-scored savings (if anything, it likely understates the bill’s savings). Overall, CBO’s Social Security baseline assumes much larger deficits than SSA’s baseline. Therefore, this legislation closes less of the Social Security gap under CBO’s baseline.
- Due to limited data, these per-person calculations assume that each retiree’s income quintile is the same for both lifetime earnings and postretirement income. Additionally, the per-couple cost is a best estimate based on limited data on the Social Security Reform Act.
- See “Letter to the Honorable Sam Johnson,” table B-1, p. 22, which can be used to calculate that the cost of the winners and losers within the bottom 40% net out to approximately zero. On disability, see Jim McCrery and Earl Pomeroy, SSDI Solutions: Ideas to Strengthen the Social Security Disability Insurance Program (Conshohocken, Pa.: Infinity, 2016).
- CBO, “Letter to the Honorable Larry Craig,” Dec. 22, 2004.
- A breakdown of CBO’s 2018–28 Medicare baseline is at https://www.cbo.gov/sites/default/files/recurringdata/51302-2018-04-medi.... That breakdown is then modeled out through 2048 to fit the Medicare estimates in CBO, “The 2018 Long-Term Budget Outlook,” June 26, 2018, and supplemental tables at https://www.cbo.gov/system/files?file=2018-07/51119-2018-06-ltbo.xlsx. Additional data come from the Boards of Trustees, “2017 Annual Report of the Boards of Trustees of the Federal Hospital Insurance and Federal Supplementary Medical Insurance Trust Funds,” July 13, 2017, with expanded and supplementary tables at https://www.cms.gov/Research-Statistics-Data-and-Systems/Statistics-Tren....
- Jack Hoadley, Juliette Cubanski, and Tricia Neuman, “Medicare Part D in 2016 and Trends over Time,” Kaiser Family Foundation, Sept. 16, 2016; see also Lori Montgomery, “You May Want to Thank George W. Bush—Not Obamacare—for the Remarkable Medicare Cost Slowdown,” Washington Post, Oct. 22, 2014.
- CBO, “A Premium Support System for Medicare: Updated Analysis of Illustrative Options,” Oct. 5, 2017.
- For more on Medicare reform, see James C. Capretta, “Rethinking Medicare,” National Affairs, Spring 2018; Andrew Biggs et al., “Increasing the Effectiveness and Sustainability of the Nation’s Entitlement Programs,” American Enterprise Institute, June 2016.
- One limitation on the potential new savings from Medicare efficiency reforms is that CBO’s long-term baseline already assumes that Medicare’s “excess cost growth”—essentially the growth of per-capita spending beyond the growth of the per-capita GDP—will decline gradually through 2048. In other words, modest efficiency savings are already built in to CBO’s baseline.
- These figures reflect the gross cost of Medicare and are not affected by the later income-relating of premiums.
- Margaret H. Davis and Sally T. Burner, “Three Decades of Medicare: What the Numbers Tell Us,” Health Affairs 14, no. 4 (Winter 1995): 2231–43.
- See CBO, “Raising the Age of Eligibility for Medicare to 67: An Updated Estimate of the Budgetary Effects,” Oct. 24, 2013.
- Gross efficiency savings would be $5.1 trillion, but $0.9 trillion of those savings would go to seniors in the form of lower Part B premiums, leaving $4.2 trillion saved by the government. This $0.9 trillion saved by seniors would partially offset the $5.9 trillion cost of income-relating Part B.
- There is a case for income-relating Medicare based on lifetime income (much as Social Security does) rather than postretirement income. See Andrew G. Biggs, “Means Testing and Its Limits,” National Affairs, Spring 2011. Biggs also explains that raising Medicare premium rates too steeply up the income ladder would create damaging implicit marginal tax rates for retirees. Under the blueprint in this report, Medicare premium increases would likely peak at around $17 per $100 increase in retiree income for those in the 61st–80th income percentile by 2048.
- By that point, per-capita Medicare costs would be growing by little more than the inflation rate. This is not likely realistic.
- Subtotals of CBO’s 2018–28 Medicaid baseline are at https://www.cbo.gov/sites/default/files/recurringdata/51301-2018-04-medi.... Those subtotals are then modeled out through 2048 to fit the Medicaid estimates in CBO, “The 2018 Long-Term Budget Outlook,” and supplemental tables at https://www.cbo.gov/system/files?file=2018-07/51119-2018-06-ltbo.xlsx.
- Medicaid spending would continue to grow under current law through 2022, providing a healthy base year when the 2023 caps are set. However, the elimination of the enhanced matching rate for higher-income adults would be gradually phased in through 2028. For example, from 2023 through 2028, states that had previously adopted this higher match rate would see slightly lower per-capita caps for nondisabled adults.
- For examples of promising Medicaid reform options, see Biggs et al., “Increasing the Effectiveness and Sustainability of the Nation’s Entitlement Programs,” pp. 24–31.
- The baseline for “other mandatory” spending begins with CBO’s 10-year baseline (“The Budget and Economic Outlook: 2018 to 2028” and thereafter holds each program’s spending constant at the 2028 percentage of GDP. CBO’s “2018 Long-Term Budget Outlook,” which was released on June 26 and reflects a current-law baseline, assumes a gradual decline in this spending as a percentage of GDP between 2029 and 2048.
- OMB, “Historical Tables,” table 8-4, February 2018.
- Half of 5.1% of GDP in discretionary spending is 2.55%. It is rounded off to 2.6%.
- Half of 5.1% of GDP in discretionary spending is 2.55%. It is rounded off to 2.6%
- See note 46.
- See CBO, “Options for Reducing the Deficit, 2017–2026,” December 2016, pp. 269–75.
- Ibid., pp. 171–72. CBO estimates are expanded to 2027–48, by using CBO’s 2026 scores constant as a percentage of GDP. Also, the budgetary savings are multiplied by two because the payroll-tax rate would rise 1 percentage point each for Medicare and Social Security. There is no limit to the amount of income subject to the Medicare payroll tax. Income subject to the Social Security payroll tax is capped. In this blueprint, earnings above the cap would be subject to an additional 1-percentage-point income-tax increase, so the total 2-percentage-point increase in the combined Medicare and Social Security payroll tax continues up the income ladder.
- The tax base for the income tax is not identical to the payroll-tax base, yet it is close. One alternative to the 1% increase in the payroll tax above the Social Security earnings cap is to eliminate the cap. Doing so would constitute a massive tax increase, pushing combined federal and state marginal tax rates as high as 65%, with a consequent depressive effect on economic growth.
- The idea of putting major entitlements on a 30-year budget that would be reassessed every five years has been endorsed by a bipartisan group of top policy experts. See Brookings-Heritage Fiscal Seminar, “Taking Back Our Fiscal Future,” April 2008.
- See U.S. Census Bureau, “Wealth, Asset Ownership, & Debt of Households Detailed Tables: 2013,” 2017. Senior citizens (age 65 and older) have the largest net worth of all age groups (median $202,950), but even excluding illiquid home equity, their average net worth exceeds all age groups except 55–64. Additionally, seniors average nearly the same post-tax, post-transfer income as the broader population, while having lower child and mortgage expenses. See CBO, “The Distribution of Household Income and Federal Taxes, 2013,” June 8, 2016, and supplemental tables 7 and 13 at https://www.cbo.gov/sites/default/files/114th-congress-2015-2016/reports....
- Estimates of long-term senior income begin with CBO, “The Distribution of Household Income and Federal Taxes, 2013,” June 8, 2016, with supplemental data at https://www.cbo.gov/sites/default/files/114th-congress-2015-2016/reports..., where table 13 shows the 1979–2013 income distribution for elderly childless households. Figures are converted to salary-equivalent incomes by removing taxes, noncash government transfers, and noncash fringe benefits. These incomes are then projected out through 2048, using estimated income growth rates of 2.6%–4.0% annually, depending on the income quintile and sub-quintile.
- Currently, most retirees benefit from a “hold harmless” law stating that the cost of their Medicare Part B premiums cannot grow faster than Social Security benefits. For example, if a retiree’s annual cost-of-living adjustment adds $10 per month in Social Security benefits, Medicare cannot raise that person’s Part B premium more than $10 per month, which would leave the retiree with a lower net income. That policy would have to be revisited under this blueprint, which would both limit Social Security benefits and raise Medicare premiums, albeit only for middle- and upper-income earners.
- See Andrew G. Biggs, “A New Vision for Social Security,” National Affairs, Summer 2013. Biggs cites research from the Federal Reserve Bank of Chicago estimating that an elimination of the Social Security payroll tax for workers age 62 and older would nearly pay for itself though higher income and Medicare payroll taxes paid on this additional labor supply. Thus, the required budgetary offsets to this reform would be quite modest.
- This figure includes both mandatory and discretionary programs. It does not include unemployment benefits, which would nonetheless grow as well.
- This figure refers to total antipoverty and vulnerable spending—excluding health care—across mandatory and discretionary programs.
- Federal antipoverty spending—just under 4% of GDP in 2018—never reached 3% until 2002. See OMB, “Historical Tables,” February 2018, table 3.2.
- See Figure 5 for tax estimates.
- See Holahan et al., “The Sanders Single-Payer Health Care Plan.”
- See Amy Goldstein, “GOP Plan to Change Medicare Is Rooted in Bipartisan History,” Washington Post, Apr. 26, 2011; Bipartisan Policy Center, “Domenici-Rivlin Debt Reduction Task Force,” Nov. 17, 2010.
- Revenues reached 20% of GDP in 1944, at the height of World War II; and in 2000, at the height of the stock-market bubble. That revenue level has never lasted beyond one year.
______________________
Brian M. Riedl is a senior fellow at the Manhattan Institute. Previously, he worked for six years as chief economist to Senator Rob Portman (R-OH) and as staff director of the Senate Finance Subcommittee on Fiscal Responsibility and Economic Growth. Follow him on Twitter here.
Are you interested in supporting the Manhattan Institute’s public-interest research and journalism? As a 501(c)(3) nonprofit, donations in support of MI and its scholars’ work are fully tax-deductible as provided by law (EIN #13-2912529).